TAG.ME
Taxonomic Assignment of Genetic Markers for EcologyDatabase construction
Users can build their own databases to train their models.
It is necessary one FASTA file containing the Marker Genes sequence and one Taxonomic description for each sequence.
* Filter your files to keep only sequences with precise taxonomic assignment
In this example we used Silva SSU database.
- Download the lastest Silva release.
- Format the taxonomic information.
- Select only prokaryotes sequences.
- Output:
- Fasta file with prokaryotic sequences.
- Taxonomic mapping to each sequence.
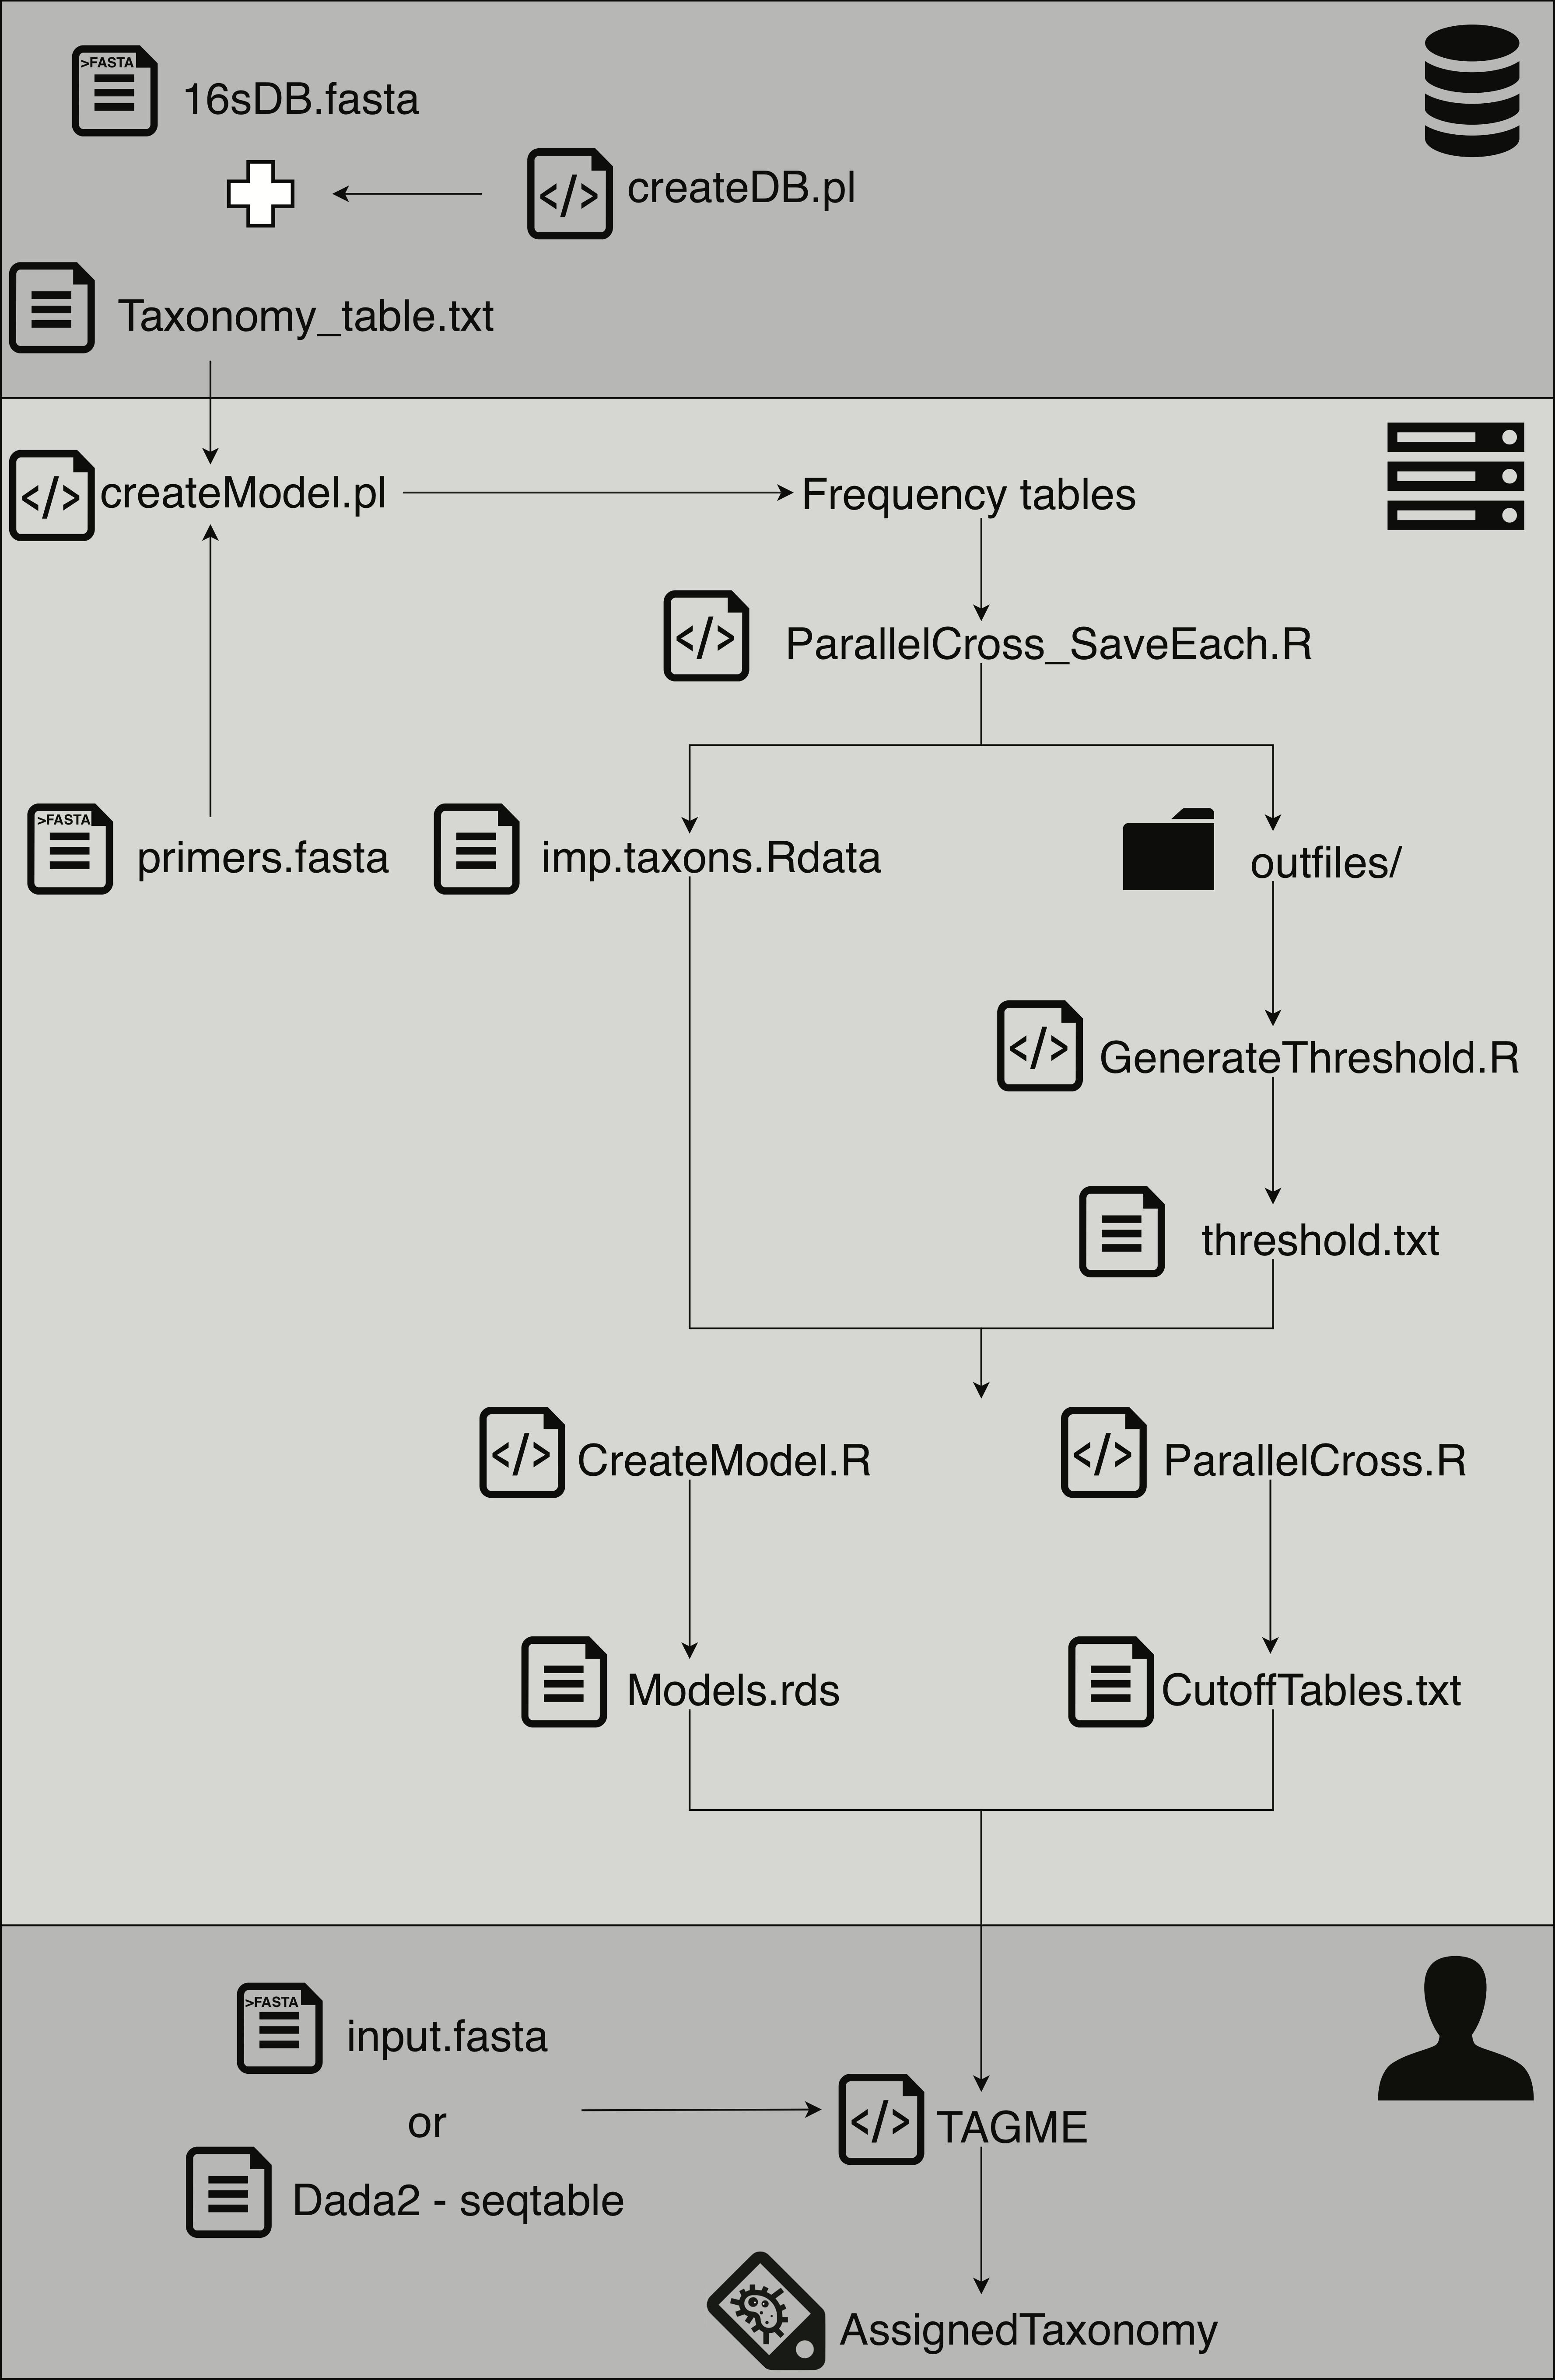
This step is performed by a script: perl createDB.pl
Generate Amplicons
Requires:
Bioperl
Bowtie
Vsearch
- Generate amplicon based on selected primers.
- Dereplicate amplicons to keep unique sequences.
- Calculate the Last Common Ancestor for each cluster of sequences.
- Calculate the Tetra Nucleotide Frequencies for sequences.
- Filter informative dereplicated sequences based on LCA signature. For each taxonomic level (Domain, Phylum, Class, Order, Family, Genus, Specie), Excludes sequences containing:
- unculture
- unclassified
- Unknow
- incertae_sedis
- Candidatus
- Other imprecise classification
This step is performed by a script: perl createModel.pl
Usage:
perl createModel.pl -pr <primers.fasta> -fa <16sDB.fasta> [options]
    Options:
    -o: Output directory to create the models. [default: .]
    -t: Number of threads [default: 1]
    -min: Minimum length of amplicon [default: 200]
    -max: Maximum length of amplicon [default: 600]
    -mm: Mismatches allowed in PCR [default: 3]
Defining parameters and calculating scores
For each taxon, cumulative variable importance (from 70% to 100%, by 10%), and class limit size (from 80 percentile to 100 percentile, by 5), calculate Sensibility, Specificity:
- Generate a default model to calculate the relative importance of each feature
- List the classes
- 40% randomly removed to create the NEGATIVE group
- 60% remainder create the POSITIVE group
- From the POSTIVE group
- Randomly select 60% of points to create the TRAIN dataset
- 40% remainder create the TEST dataset.
- Repeat the procedure 20 times.
- Save one TXT file with the calculated Sensibility, Specificity, PPV and NPV for each time.
- The metrics are measured for each cutoff value of score, from 0.1 to 10, by 0.1.
- Score formula: Score = log2 ( P(α) / P(β) ) × P(α), where:
- α = Best prediction probability
- β = Second best prediction probability.
This step is performed by the script:
for v in 70 80 90;
   do Rscript ParallelCross_SaveEach.R -v $v;
done;
for p in 0.85 0.9 1;
  do Rscript ParallelCross_SaveEach.R -v 80 -p $p;
done;
Requires:
R
library(optparse)
library(randomForest)
library(doMC)
Calculate Thresholds
Calculate the best values of:
- Number of features, and
- Maximum number of points per class,
to build the model for each taxon.
The number of features is estimated by the cumulative sum of the relative importance of each feature until it reaches the cutoff value: 70, 80, 90 and 100%.
The maximum number of points is estimated by the distribution of "points per class" and limited to a percentile cutoff: 80, 85, 90, 95 and 100 percentiles.
For each taxon, cumulative variance and percentile to limit number of points, takes each of the 20 files in "outfiles" folder and calculates the Area Under the Curve (AUC).
Keeps increasing the values until there is no improvement in AUC values (t-test < 0.05).
Run script: Rscript GenerateThreshold.R
Calculate Specificity per Score cutoff
Perform 20 fold Cross Validation Model Construction, similar to the previous CrossFold test using the threshold values calculated in previous step.
Generate tables for each taxon containing the Specificity of prediction for each Ratio cutoff value from 0.1 to 10.
The input files are the importance variable for each taxon and the threshold.txt calculated.
The output are TXT files containing the cutoff values. This file will be used as input for the prediction step.
Command line: Rscript ParallelCross.R